Understanding Farm Financials Part 1
Whether you’re coming back to the family farm or starting up your own operation, understanding the business side of farming can be hard. Part 1 of our series walks you through filling out a balance sheet and income statement. Article includes a downloadable financial health assessment worksheet.
In this article you'll find:
- A free downloadable financial health assessment worksheet
- Balance sheet explanation
- Income statement explanation
- Cash flow statement explanation
Part 1: Get Your Numbers on Paper
Whether you’re coming back to the family farm or starting up your own operation, understanding the business side of farming can be hard. But for long-term success, becoming a saavy business owner and developing a strong financial foundation may be the most important thing you do. So where do you start?
In this 2 part series, we break down what you need to know to better understand your farm financials. In part 1, we go over what balance sheets, income statements, and cash flow are. In part 2, we dive in further and discuss ratios and benchmarks.
- Download the [Farm Balance Sheet & Income Statement] spreadsheet to put in your own financial information.
- Keep reading to help you complete the first two parts of the assessment – Balance Sheet and Income Statement!
Download & Edit: Farm Balance Sheet & Income Statement
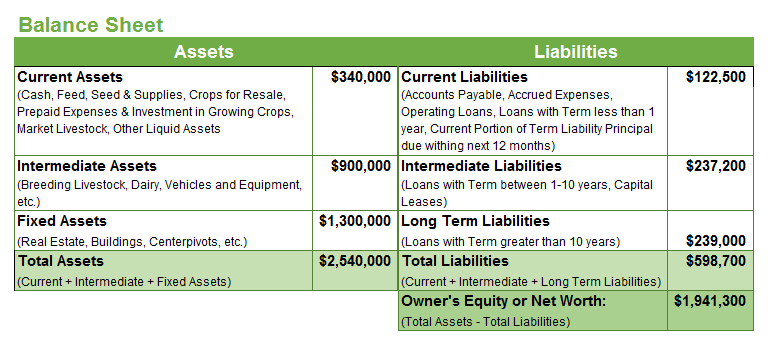
Balance Sheet
As lenders, we commonly utilize a farmer’s balance sheet for a financial reference. A balance sheet is a “snapshot” of a farmer’s financial position and it outlines an individual’s net worth. Net worth, or Equity, reflects the value or dollar amount of the reported assets you actually own, versus how much is currently financed. Balance sheets from December 31 are the most useful and coincide with taxes. Even if you aren’t requesting a loan, it’s a good idea to gauge your growth and financial position at a given point throughout the year and to keep this timing consistent from year to year. This should help you to determine both your personal and business financial position.
Assets are what you own. Some examples of assets are cash, real estate, equipment, etc. They can be broken down into 3 categories:
- Current Assets – Items you own that will be used up or sold in 1 year (ex. Feed, seed, fertilizer, crops in the ground, feeder calves to sell this year, etc.)
- Intermediate Assets – Items you own that support production. They typically have a 2-10 year life. (ex. Breeding livestock, vehicles, equipment, etc)
- Fixed/Long Term Assets – items you own that are permanent. They typically have a >10 year life. (ex. Real estate, barns, shelters, etc.)
Liabilities are what you owe. Some examples of liabilities are credit card debt, mortgages, equipment, auto loans, etc. They can also be broken down into 3 categories:
- Current Debts – These are debts to pay within 1 year (ex. Operating loan)
- Intermediate Term Debts – These are debts to pay in 1-10 years (ex. Equipment loans)
- Long Term Debts – These are debts to pay in more than 10 years (ex. Real estate)
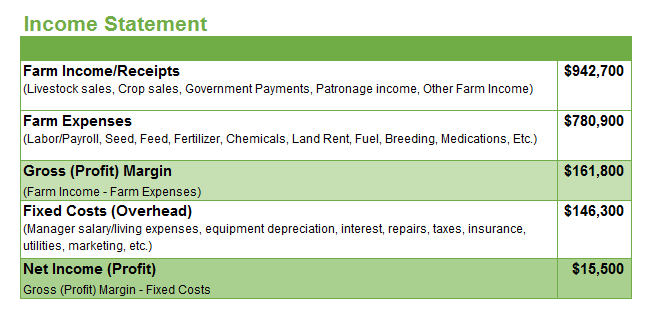
Income Statement
An income statement is used for reporting a farms financial performance over a specific period of time. Typically, income statements are created to summarize cash flow for a calendar year. However, to know the true profit of your operation, an income statement created for all income and expenses for a crop – regardless of the calendar year spent or earned – can be created. This is called Accrual Income.
The income statement focuses on 5 key items:
- Income – Money coming in from sales of products and services (Ex. Livestock sales, crop sales, government payments, patronage income, other farm income, etc.)
Gross Income is used to describe the total income that comes into the farm operation in a given year. However, it does not indicate if an operation made a profit. That can only be determined to subtracting expenses. - Expenses – Costs to the farm associated with growing the crop (ex. Labor/payroll, seed, feed, fertilizer, chemicals, land rent, fuel, breeding costs, medications, etc.)
- Gross Margin (Profit Margin) – The profit or loss of that year’s crop. It does not take into account the operation’s fixed costs. An operation should have enough Gross Profit Margin to cover the operation’s fixed costs.
- Fixed Costs (Overhead) – Costs to the operation that occur regardless crop or livestock production. (Ex. Manager salary/living expenses, equipment depreciation, interest, repairs, taxes, insurance, utilities, marketing, etc.)
- Net Income (Profit) – the true picture of profit/loss of the farm operation. It is a picture of if the operating income is sufficient to cover costs of both production and overhead.
Cash Flow Statement
A cash flow statement is a listing of cash (or cash equivalents) entering and leaving an operation that occurred during the past accounting period. A cash flow budget is a projection of future flows that would include expected payments or payments to accounts receivable. Think of this as a “check book registry.”
Part 2: The Numbers Say What?
In our next article, Understanding Farm Financials Part 2, we go over farm financial ratios, benchmarks, and more!
Questions?
We hope this information is helpful in helping you understand your farm finances. If you're looking to purchase land, farms or homes in Georgia, North Carolina, or South Carolina and have questions about the loan application process one of our loan officers would me more than happy to help. Find an AgSouth Branch near you!
Not in Georgia, North Carolina, or South Carolina? Find your Farm Credit Association.